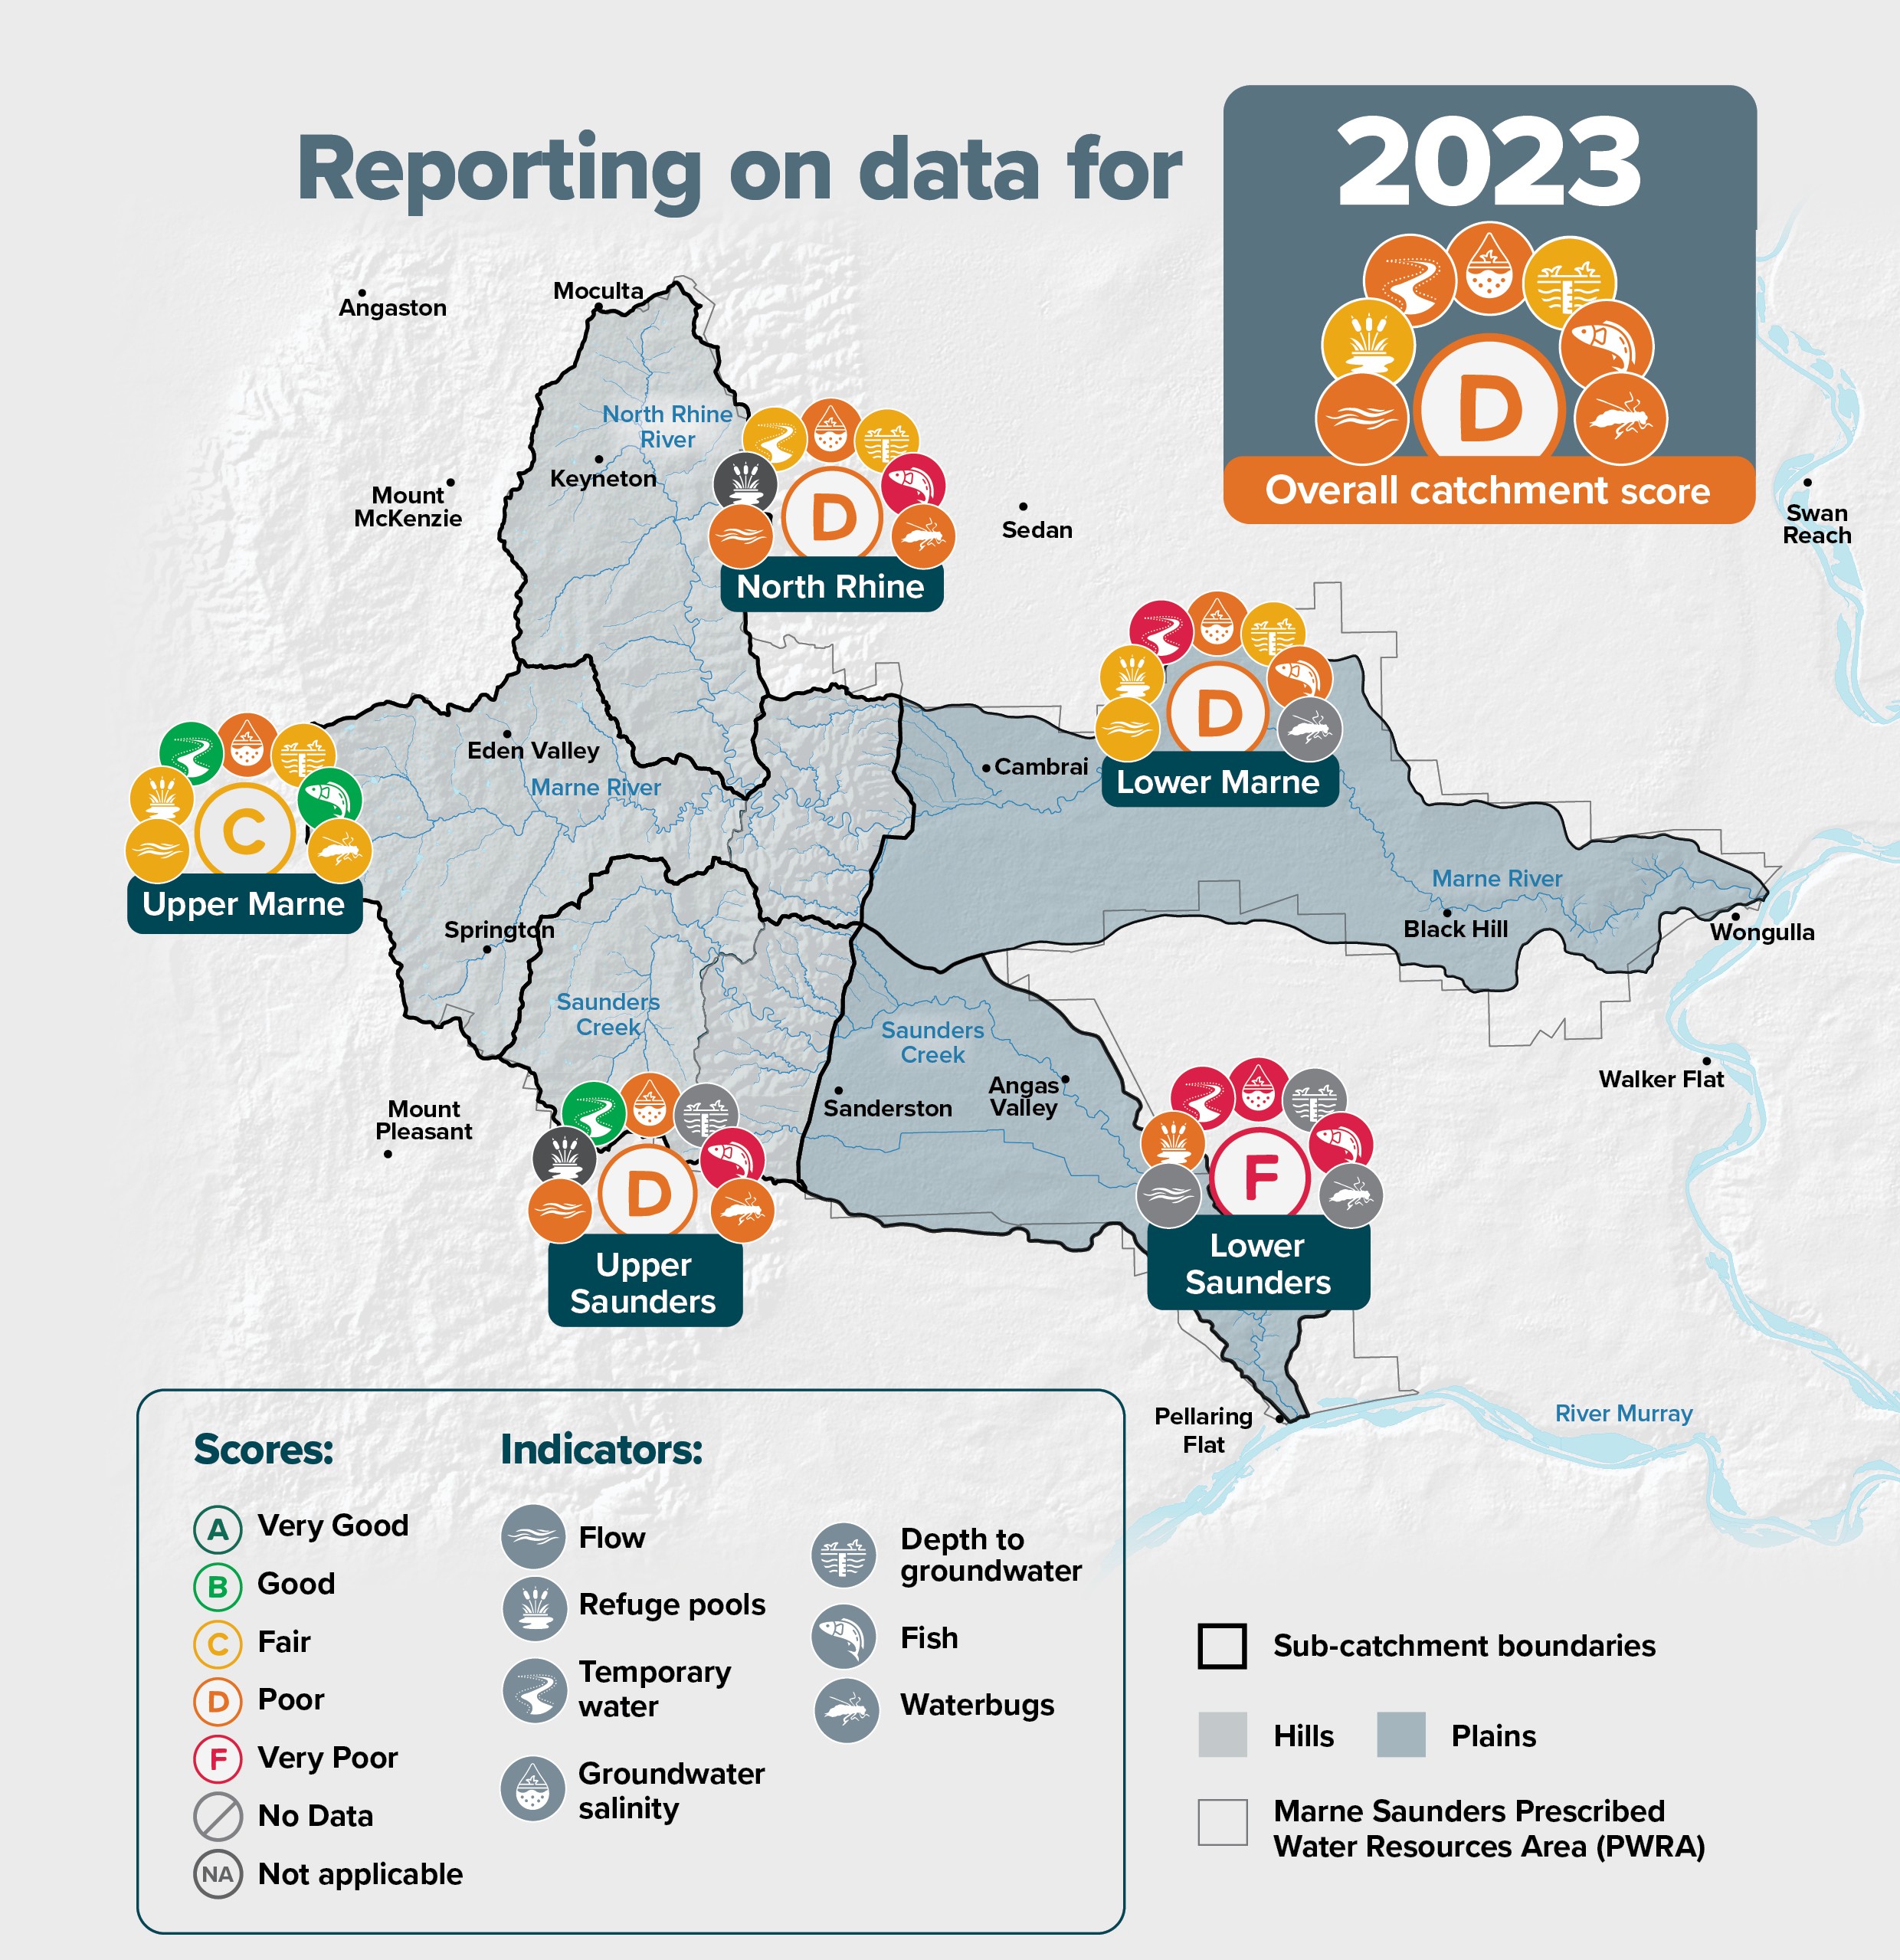
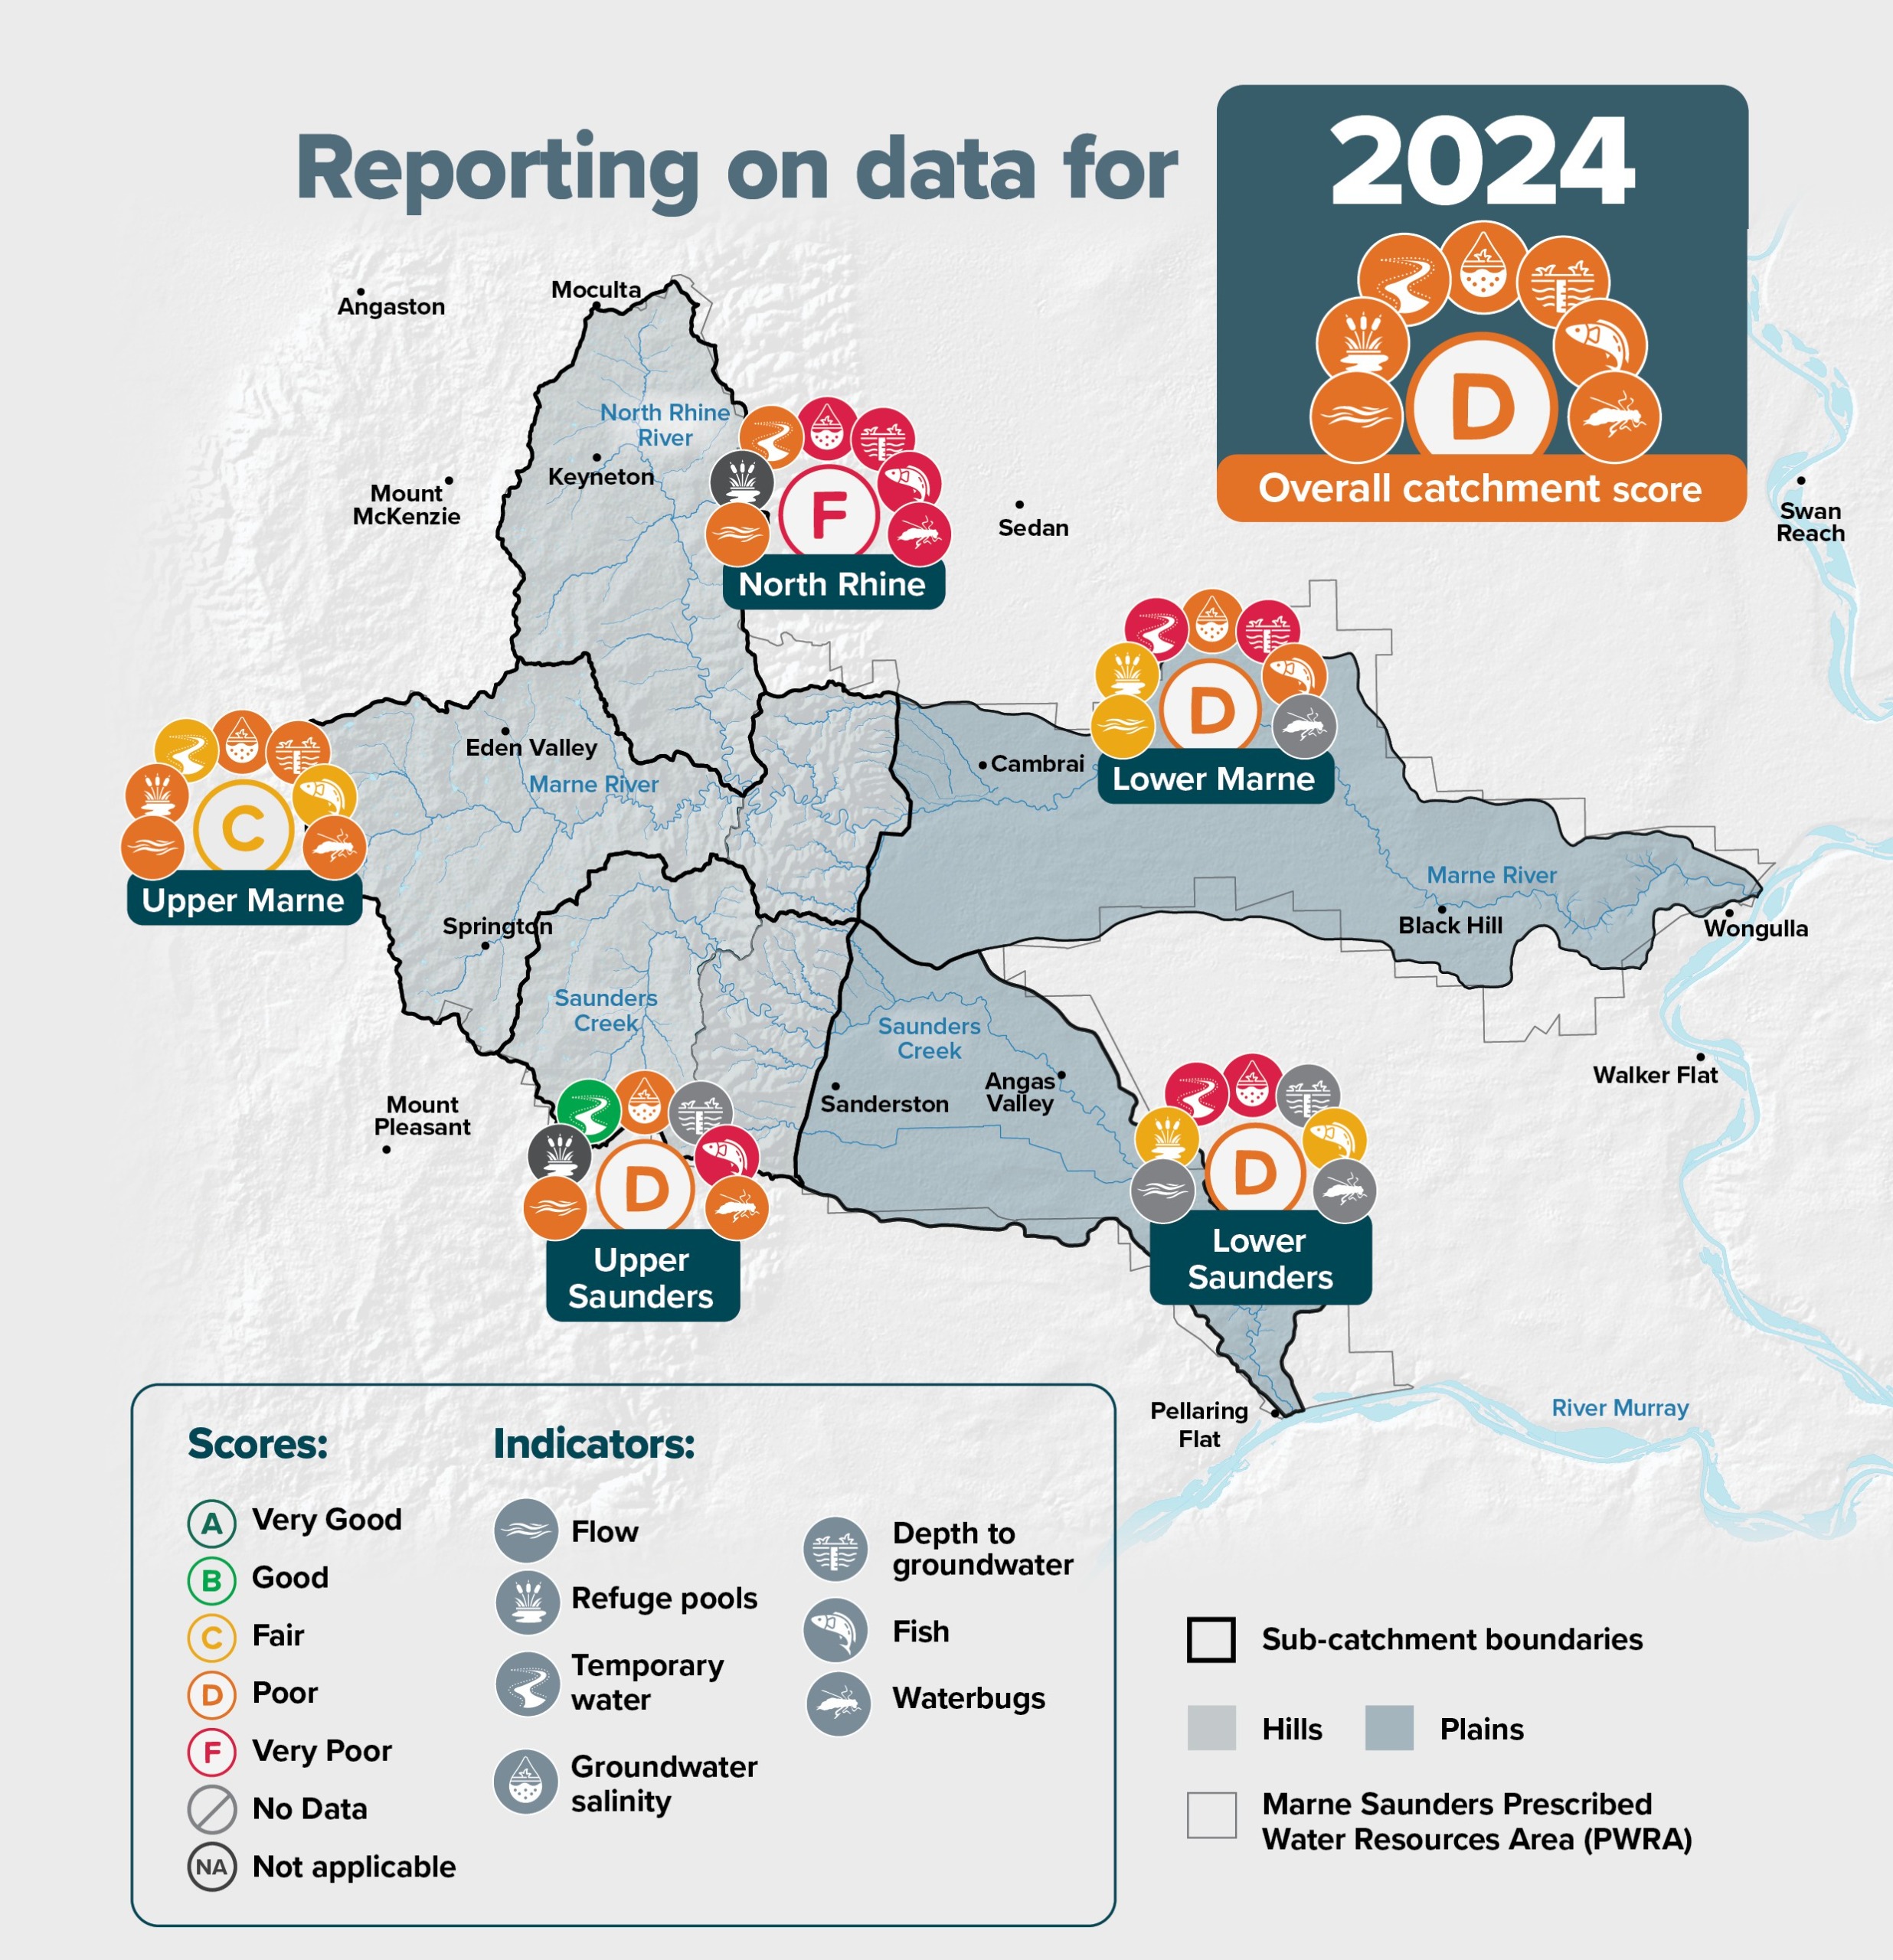
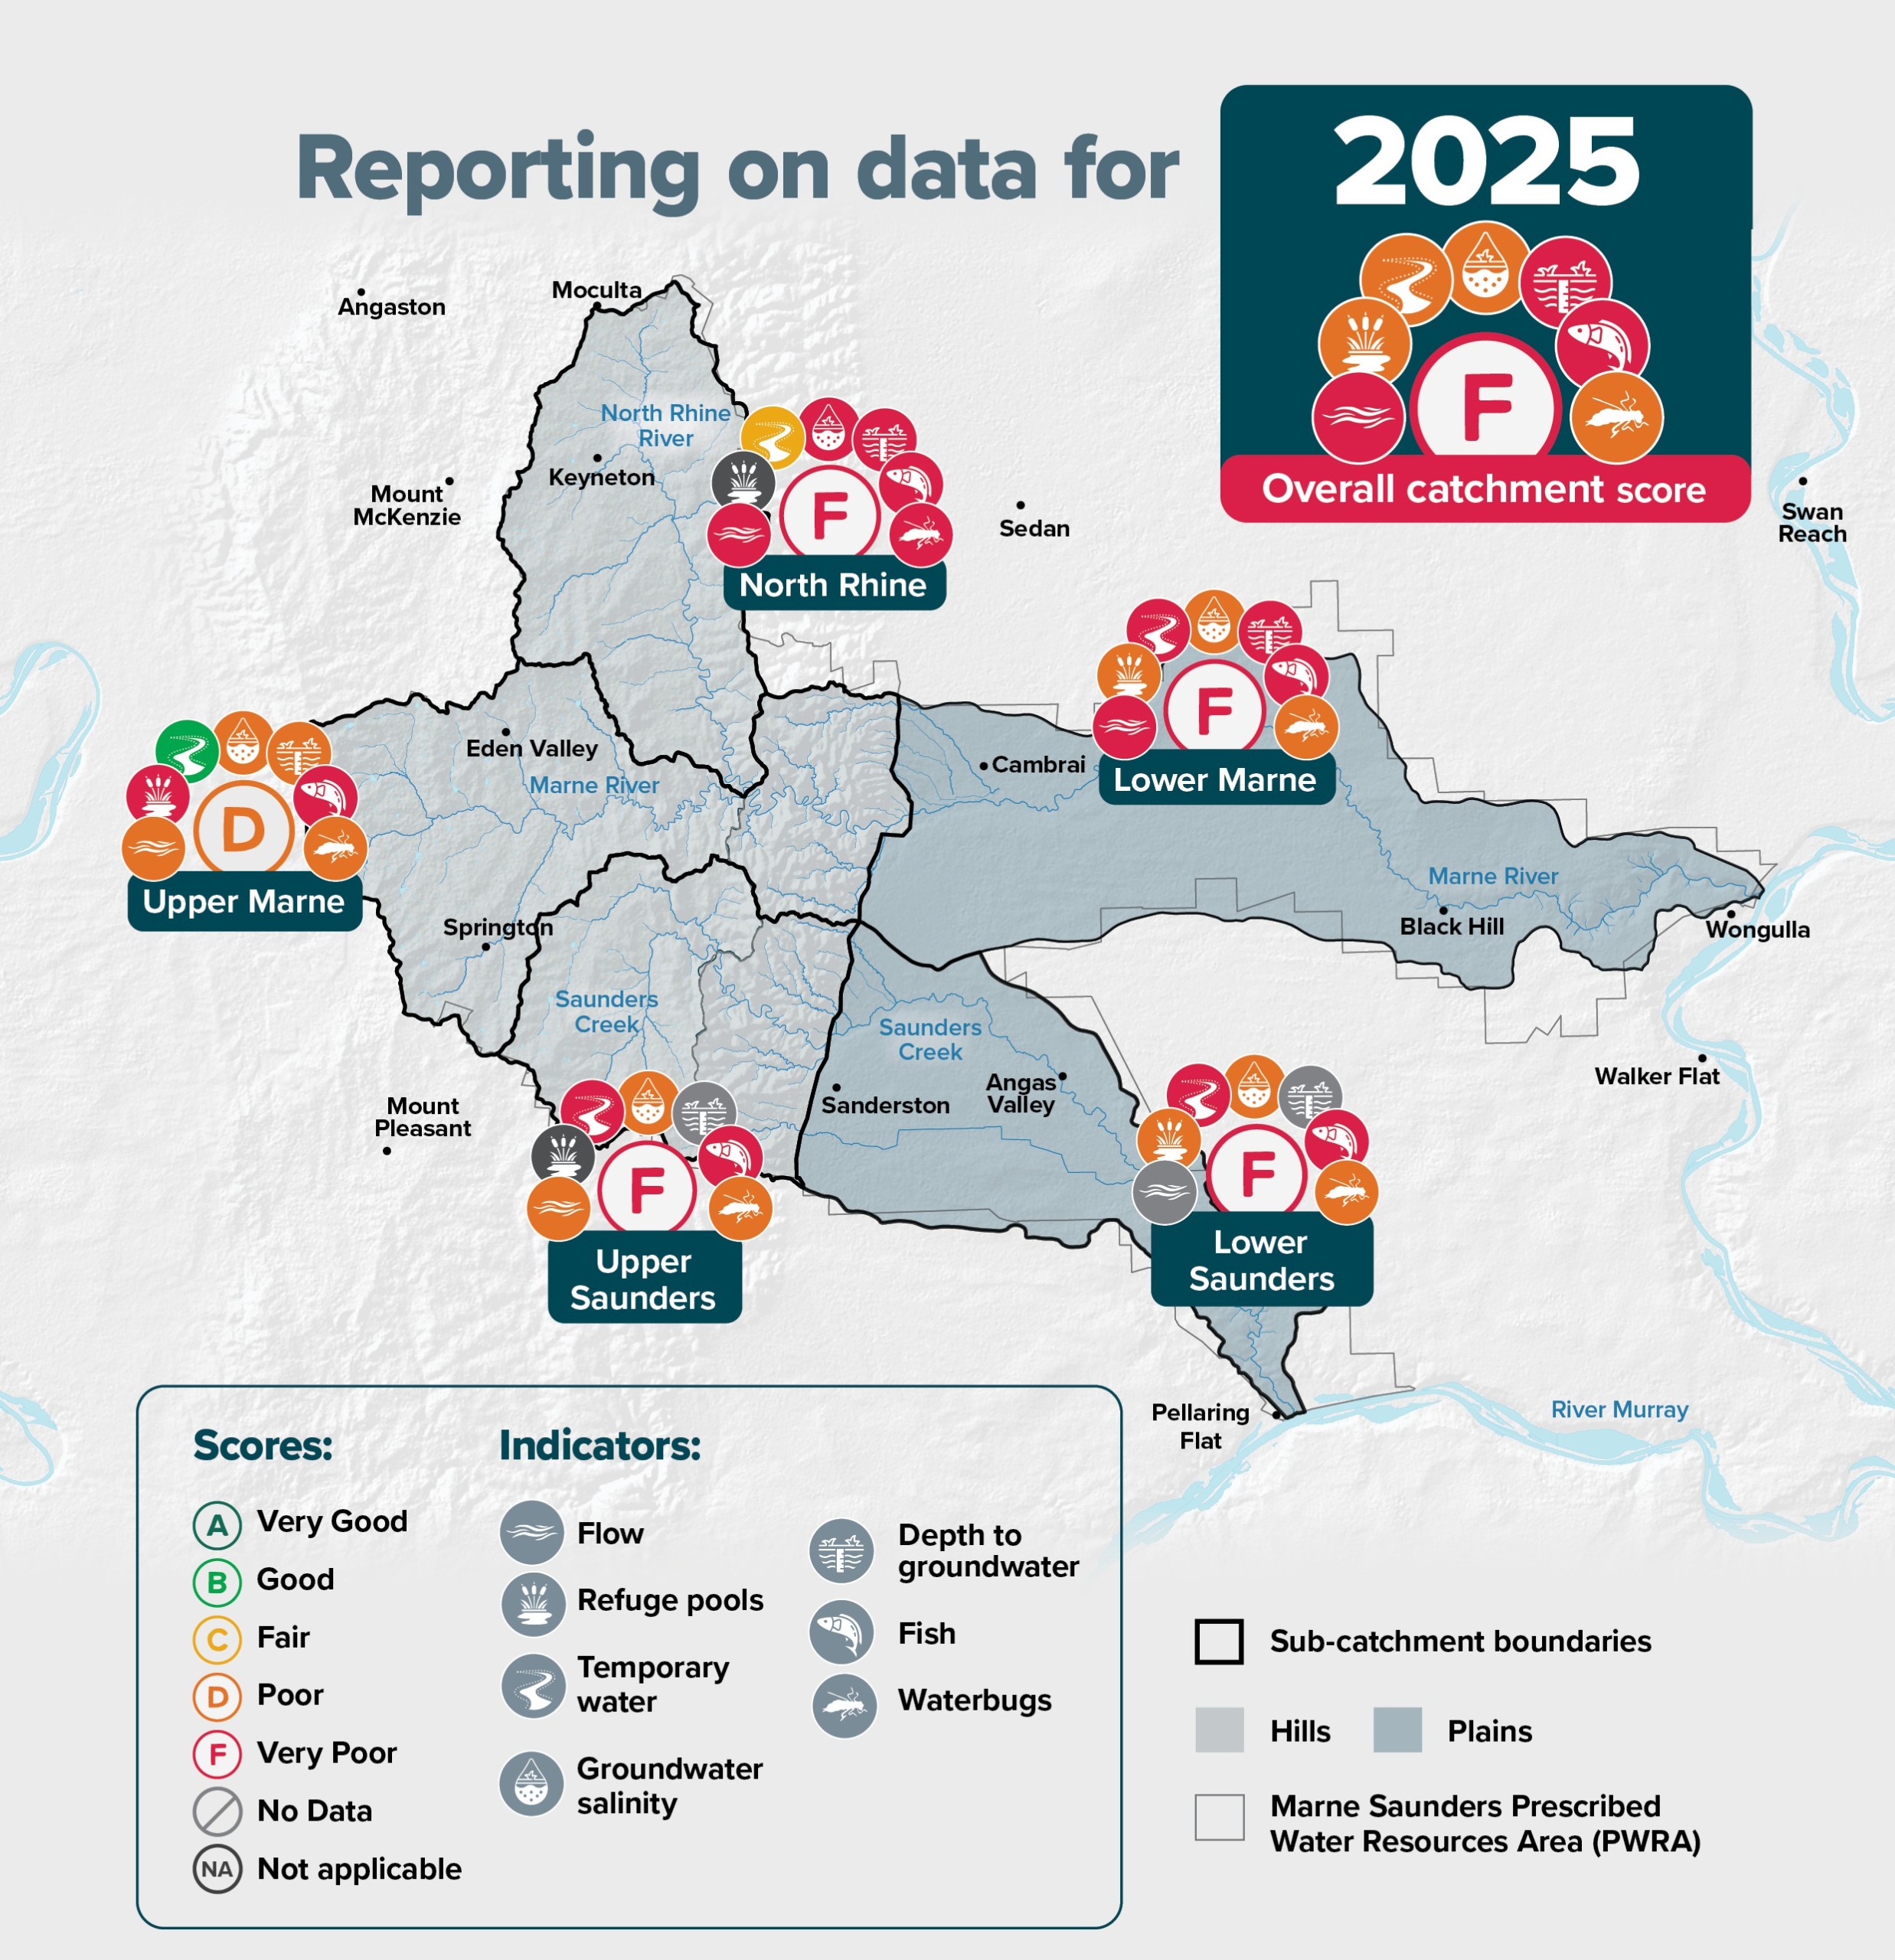
Overall catchment results
The Marne Saunders catchment scored an overall score of D for both 2023 and 2024 and F for 2025.
This means the catchment is assessed as in a very poor state of health.
This is in line with expectations, as it is widely understood and reported by community members that the catchment is significantly degraded environmentally and that the rivers flow and flood much less frequently than remembered in the past.
What is going on?
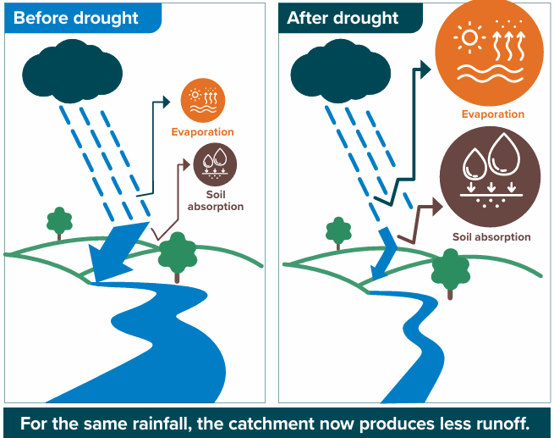
The poor result reflects both a changing climate, including lower annual rainfall, reduced autumn and spring rainfall, the break in season arriving later, and higher temperatures, resulting in less water available in the catchment. This is compounded by the large number of dams in the hills.
Rain in this catchment predominantly falls in the hills, where most of the larger dams are located. Many of these dams were built prior to government regulation of water resources. They lose water through evaporation and intercept flow, preventing water from moving downstream until after they have filled. This reduces overall flow, shortens the flow season in the rivers, and contributes to declining environmental health of the catchment. These changes increase salinity and place stress on aquatic organisms, leading to decreased biodiversity and a restricted breeding window for fish and other species.
Groundwater in the lower plains is also recharged from flows from the hills. Both watercourse and groundwater are needed to refresh and maintain important river pools. Without this, pools become increasingly shallow, saline, and low in in dissolved oxygen, reducing their suitability as dry-season refuge for aquatic life.
These refuge pools were once critical habitat for the river blackfish, which is now considered functionally extinct in the Marne Saunders catchment.
How it affects streamflow, groundwater recharge and catchments in general.
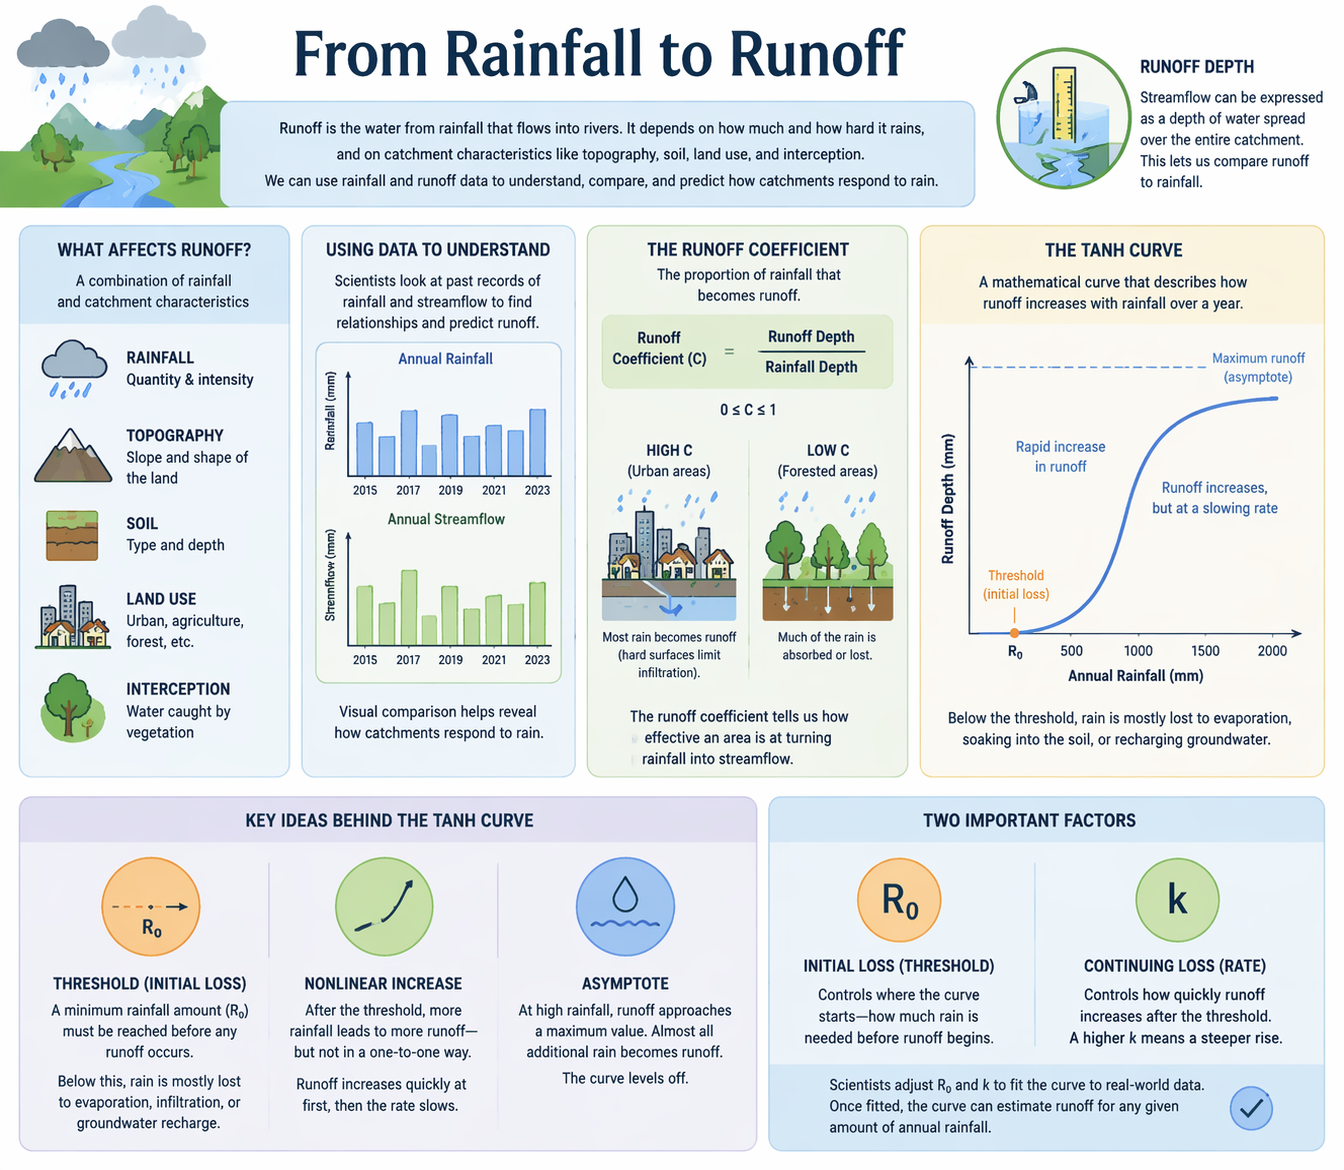
Runoff generated from a catchment depends on both the amount and intensity of rainfall, as well as catchment characteristics such as topography, soil type and depth, land use, and vegetation interception. The relationship between rainfall falling on a catchment and the runoff it produces (known as the ‘rainfall–runoff response’) can be described using a range of methods. For the purposes of this report card, the rainfall–runoff response is evaluated through analysis of annual rainfall and streamflow data.
Rainfall and river‑flow information collected each day is used to understand how much rain turns into water flowing in rivers. This can be looked at for individual rain events (for example, after a storm) and also over a whole year. The amount of water flowing in a river (called streamflow) can be converted into a runoff depth (expressed in mm). This simply means imagining that water spread evenly across the whole catchment area, so it can be compared easily with rainfall. By analysing past records of annual rainfall and annual river flow, hydrologists develop a relationship between how much rain falls each year and how much water flows out of a catchment in that year. This, non-linear relationship, is known as the rainfall–runoff relationship, and it is used to estimate how much runoff may occur in the future. One commonly used rainfall–runoff relationship is called the Tanh relationship. This uses a mathematical curve to show how annual runoff changes as annual rainfall increases. Another simple way to describe the rainfall–runoff response is the runoff coefficient. This is calculated by dividing the annual runoff by the annual rainfall. It shows the proportion of rainfall that ends up flowing through the catchment as river water.A high runoff coefficient means most of the rain becomes runoff (common in cities, where water can’t soak into the ground easily). A low runoff coefficient means much of the rain is absorbed into the soil or lost (common in forests).
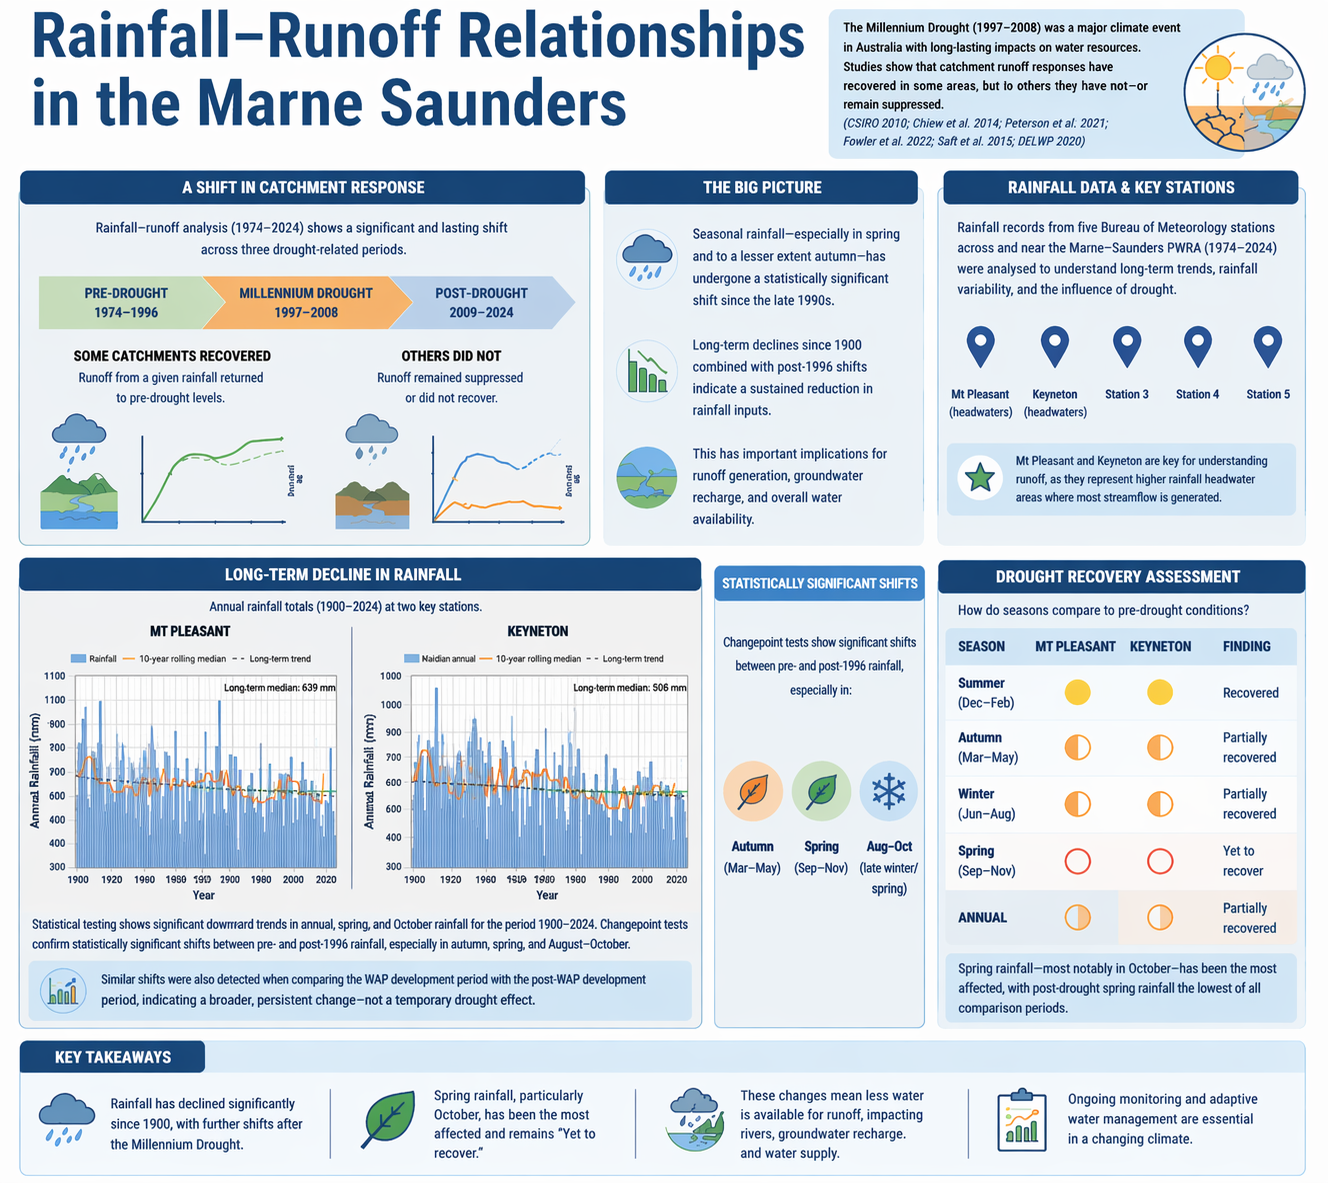
The recent Millennium drought, spanning from 1997 to 2008, was a major climate event observed across Australia. It is considered to have had a major impact on water resources across the country (CSIRO 2010). Numerous studies into the impact of the drought have since been undertaken, researching the rainfall-runoff responses of catchments pre- and post-drought (Chiew et al. 2014; Peterson et al. 2021; Fowler et al. 2022; Saft et al. 2015). This has been observed in the Barossa PWRA1 and in catchment across the MLR2,3 as reported in recent hydrological investigations.
 Rainfall–runoff analysis for the Marne River catchment from 1974 to 2024 reveals a significant and lasting shift in catchment response across three drought-related periods. Rainfall records from five Bureau of Meteorology stations across and near the Marne–Saunders PWRA were analysed to understand longterm trends, rainfall variability, and the influence of drought on seasonal and annual rainfall patterns. While data from all stations informed the assessment, Mt Pleasant and Keyneton were most important for understanding runoff, as they represent rainfall conditions in the higher rainfall headwater areas where most streamflow is generated. Detailed trend analyses at the two key stations reveal a long-term decline in annual rainfall totals. Statistical testing shows significant downward trends in annual, spring, and October rainfall for the period 1900–2024. Additional changepoint tests confirm statistically significant shifts between pre and post1996 rainfall, especially in autumn, spring, and key late winter and spring months (August–October).
Findings
Assessments of drought recovery further show that seasonal rainfall patterns have not returned to earlier conditions. Spring rainfall—most notably in October—has been the most affected, with post drought spring rainfall being the lowest of all comparison periods and classified as “Yet to recover.” Winter and autumn rainfall have also declined since the Millennium Drought, placing both stations in the “Partially recovered” category for these seasons as well as for annual totals.
Overall, the evidence demonstrates that seasonal rainfall, particularly in spring and to a lesser extent autumn, has undergone a statistically significant shift since the late 1990s. Combined with long-term declines observed since 1900, the results indicate a sustained reduction and changing seasonality in rainfall inputs to the catchment, with important implications for runoff generation, recharge to ground water, environmental flow regimes and overall water availability.
2 Savadamuthu K and McCullough DP (2024). Impacts of changing rainfall patterns on the hydrology of the Mt Lofty Ranges, DEW Technical report DEW-TR-2024-8, Government of South Australia, Department for Environment and Water, Adelaide. (https://www.waterconnect.sa.gov.au)
3 Kumar Savadamuthu, 2025. ‘Prolonged shifts in rainfall and runoff response in the Mt Lofty Ranges, South Australia’, 26th International Congress on Modelling and Simulation, Adelaide, SA, Australia, Dec 2025.
What can we do?
Dam owners can participate in the Flows for the Future program by installing low flow bypasses.
Dams capture all early-season autumn flows until they fill and begin to spill over, significantly shortening the natural flow season. Low flow bypasses allow small volumes of water from minor rainfall events to pass downstream, rather than being captured. Larger volumes of water flow still enter the dam.
This approach has only a small impact on the total volume of water captured but provides significant benefits for watercourse health.
Other community members can assist by getting involved in citizen science projects such as Waterwatch, Waterbug Bioblitzes, microbat monitoring, TurtleSAT and iSPYthon (to name a few). These projects increase the amount of data we have for this catchment and could be included in future report cards.
Other land management activities likely to have a positive impact on catchment health include:
- Protect remaining native vegetation, especially big old red gums.
- Attend weed control workshops and undertake weed control along creeklines.
- Revegetate your property, particularly creeklines and create biodiverse corridors of native vegetation and slow water run-off.
- Encourage living roots in the soil all year.
- Minimise soil disturbance.
- Reduce fertiliser use for crops and switch to natural options like manure, composts and bio fertilisers (and no fertiliser use at all for native grasslands).
- Fence off creek lines to prevent erosion and fouling by stock.
- Reduce grazing in dry times, manage grazing to allow paddocks to rest.
- Undertake erosion control on creeks.
- Install low flow bypasses or reduce the capacity of your dam.
- Turn your dam into habitat for wildlife by planting native plants in and around the dam, and installing a turtle and waterbird nesting island (if the dam is large enough).
- Install bird and bat boxes to replace the past loss of tree hollows.
There are grants available through the Murraylands and Riverland Landscape Board, local councils and others, that may be able to assist with the costs of undertaking these activities.
Note: Some of the activities listed above could inadvertently have negative impacts on watercourses, floodplains and groundwater, if not done in the right way. To prevent this, landholders are responsible for ensuring approvals are in place before works start.
There are also restoration programs led by the Murraylands and Riverland Landscape Board, and local environmental work and support by Mid Murray Landcare SA, plus other community initiatives that people can connect with.
All community members can participate in the upcoming water allocation plan review process to design future water policy that supports a sustainable future for the catchment.
Catchment health indicator scores
Surface water flow
 In a seasonal catchment such as the Marne Saunders, rainfall and flow patterns strongly influence the availability and quality of aquatic habitat for species including fish and macroinvertebrates (waterbugs). Regular flows help maintain water quality, prevent salinity build-up, and support feeding, breeding and refuge habitat.
In recent years, flow patterns have changed markedly, with many sub-catchments experiencing declines that raise concerns for both water management and ecosystem sustainability.
The overall catchment score for this indicator declined from C in 2023 to D in 2024, and to F in 2025.
One key metric for the assessment of surface water health is the “break of season” (ie the length of time between wet and dry periods). A key finding is that the average break of season is now occurring after an historically long duration (that is, flows are starting much later in the year). This resulted in very low scores for this metric across much of the catchment. Delays in the break of season rains create more challenging conditions for aquatic flora and fauna; and are consistent with broader shifts in climate observed in the catchment in recent decades.
The flow regime across the catchment has shown steady declines since the 1970s.
Refuge pools
 As a seasonal river system, the Marne Saunders relies on isolated pools that persist through dry periods. These permanent pools provide critical refuge for aquatic species and serve as important water sources for native fauna during extended dry conditions.
The condition of these habitats is assessed using three key water quality indicators: dissolved oxygen (DO), salinity (electrical conductivity), and pH. Grades are assigned against thresholds based on the requirements of three priority native fish species with differing tolerances to water quality decline—river blackfish (most sensitive), obscure galaxias, and carp gudgeon (least sensitive).
Across the catchment, refuge pool condition has remained relatively stable but continues to show signs of stress. The indicator was graded C in 2023, and D in both 2024 and 2025. Monitoring results highlight ongoing water quality pressures in several sub-catchments, particularly low dissolved oxygen and elevated salinity, reducing habitat suitability for fish populations, and this is also a longer-term trend.
Lack of refuge pool availability is one of the stringest predictors of ecological decline in the catchment.
Temporary water
 Water quality at temporary (ephemeral) sites is assessed using pH, electrical conductivity (salinity), and dissolved oxygen (DO) from government sources and local citizen science programs. Scores for each parameter are averaged at each site to produce an overall water quality score.
Across the catchment, this indicator was graded D in 2023, 2024 and 2025, with an overall declining trend. These results reflect limited opportunities for temporary water to accumulate and persist. Upper sub-catchments in the hills, where rainfall is typically higher, achieved comparatively better scores, but when combined with the drier lower catchments, overall scores remained low. This indicates ongoing pressure on these short-lived aquatic habitats.
Groundwater salinity
 Groundwater salinity is assessed using data from observation wells and samples provided by bore owners through the Murraylands and Riverland Landscape Board’s monitoring program.
Salinity was consistently graded D (poor) across the catchment in 2023, 2024 and 2025, indicating widespread and persistent salinity issues.
Monitoring groundwater salinity is critical in the Marne Saunders catchment due to its influence on both environmental condition and agricultural productivity. Elevated salinity can degrade soil structure and reduce crop and pasture yields, with flow-on effects for regional economic output. It can also impact native vegetation and aquatic ecosystems, particularly where groundwater contributes to refuge pools, reducing habitat quality and biodiversity.
Depth to water
 Depth to water (DTW) is used to assess groundwater condition, identify long-term changes in groundwater levels, and inform sustainable water management. Data are collected from a network of monitoring wells using both manual measurements and continuous water-level loggers. Annual maximum (recovered) groundwater levels are derived for each well, representing conditions after seasonal pumping has ceased. Monitoring sites are located within the Marne River catchment, with no current coverage in the Saunders.
DTW was graded C (fair) in 2023, declining to F (very poor) in 2025 as the overall catchment score.
Groundwater levels have been declining consistently in the fractured rock hills zone and the plains zone sedimentary aquifers since the 1990s.
Groundwater is an important resource, supplying water for stock and domestic use, supporting deep-rooted vegetation such as river red gums, and contributing to springs and seeps that sustain refuge pools.
Fish
 Fish monitoring focuses on both native and introduced species, assessing abundance, species richness, age classes, and the presence of sensitive species.
Fish condition is scored using the AquaSave model, which provides site-based assessments of native fish diversity (including the influence of invasive species), as well as breeding and survival rates measured in April each year.
Fish condition declined across the catchment, with grades falling from D in 2023 and 2024 to F in 2025. This indicates reduced habitat quality and fewer suitable conditions to support sustainable fish populations.
Sensitive species such as river blackfish remain absent from all monitored sites and are now considered functionally extinct in the catchment. Recovery windows for native fish are now rare and many years do not provide enough flow to reconnect habitats and allow fish to recolonise pools.
Waterbugs
 Macroinvertebrates (waterbugs) are highly sensitive to changes in water quality, habitat structure, and flow regimes, making them reliable indicators of river health.
The waterbug indicator score is based on the number of species and their abundance each spring, alongside environmental factors that support stable populations. The overall condition remained a D score, with 2024 nearing F. In recent years, many sites were dry and unable to support waterbug populations, while others only provided habitat for species adapted to harsh conditions.
The long-term decline in river flow has resulted in continued scarcity or absence of more sensitive waterbug species like stoneflies and some mayflies that rely on flowing water habitats. This indicates chronically stressed conditions. This may have detrimental effects for other animals that rely on them for food.
For a more detailed analysis please read the Report Card Technical Report.
Share your feedback
Cambrai School kid's visions
Image 1 of 8